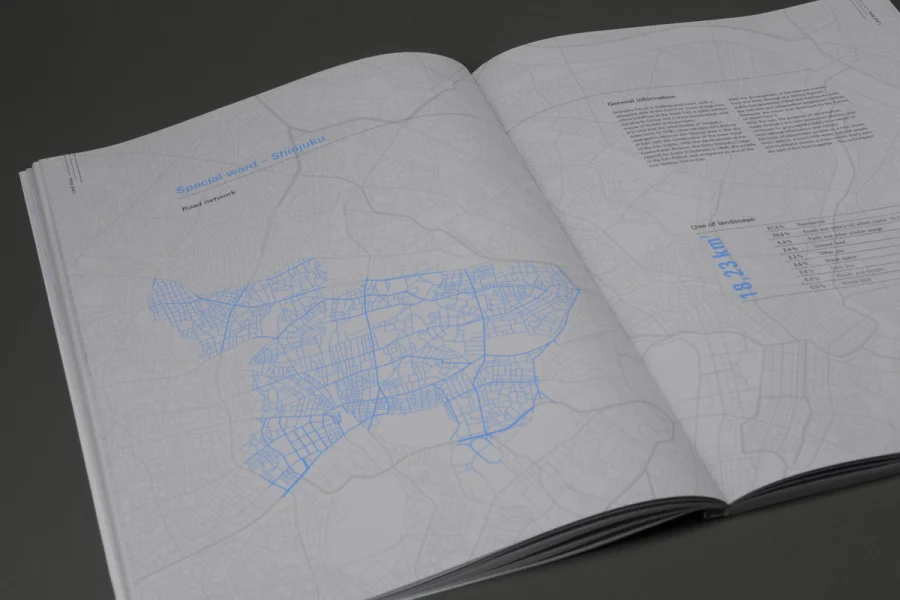
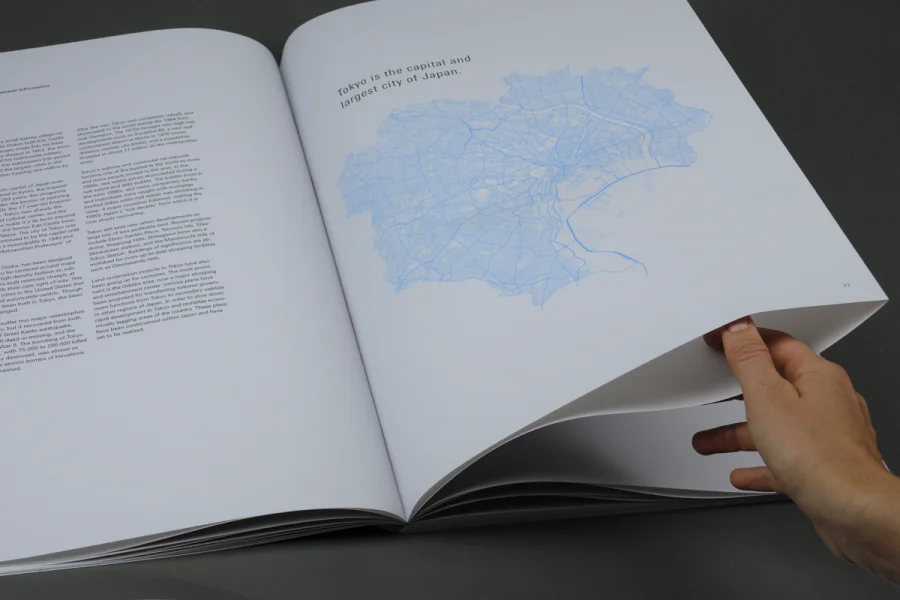
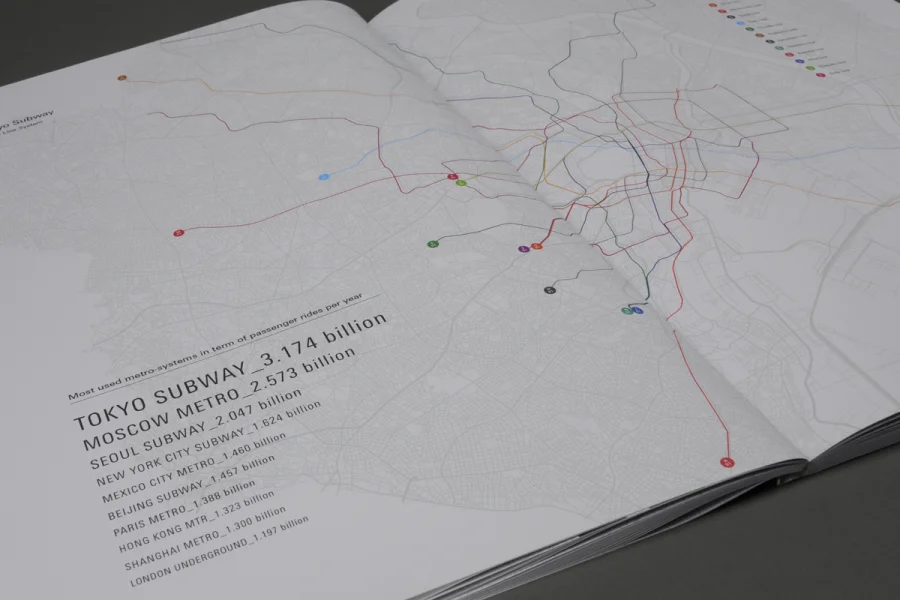
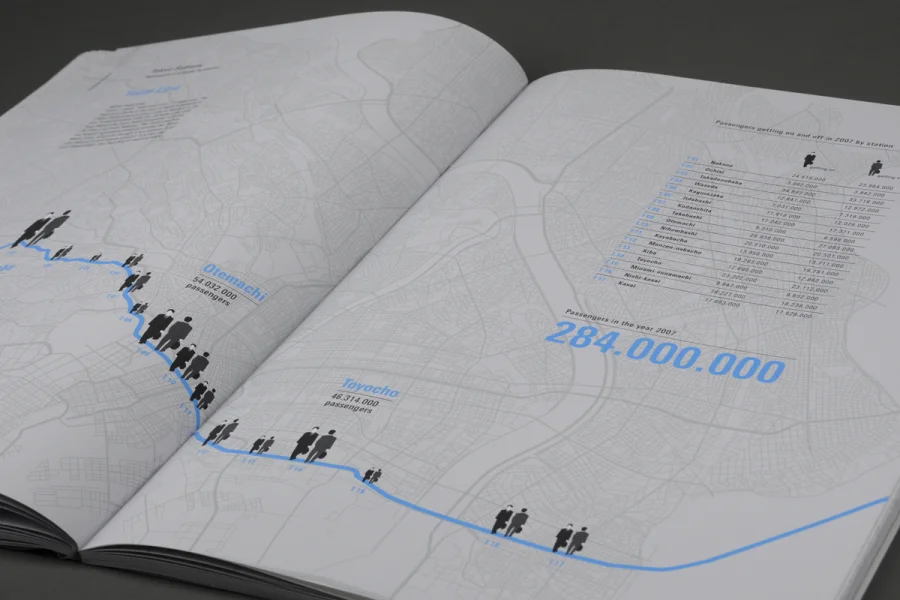
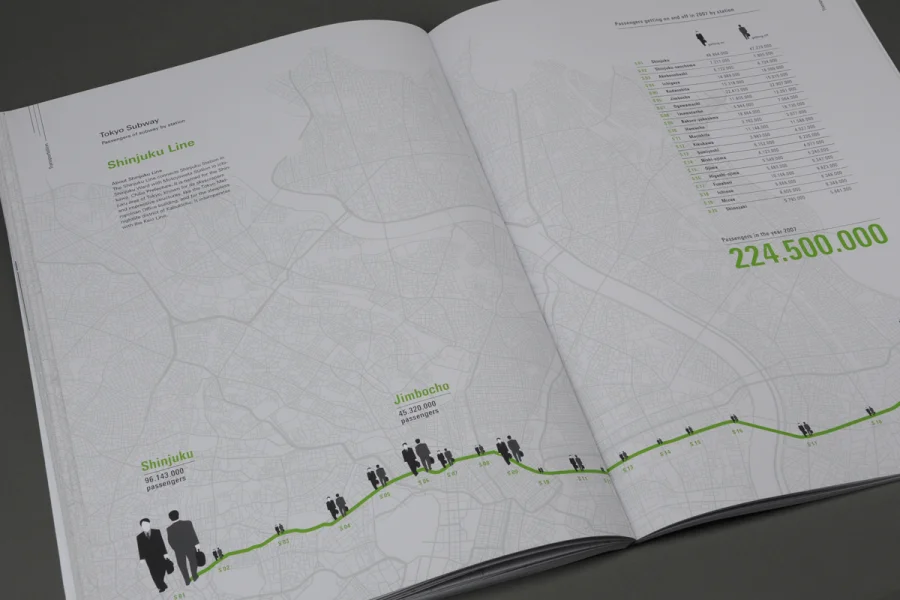
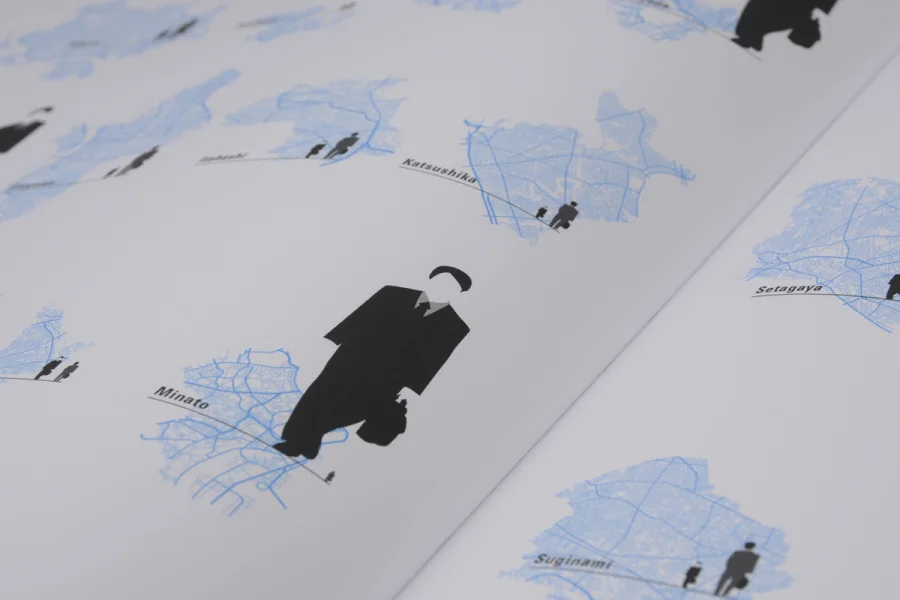
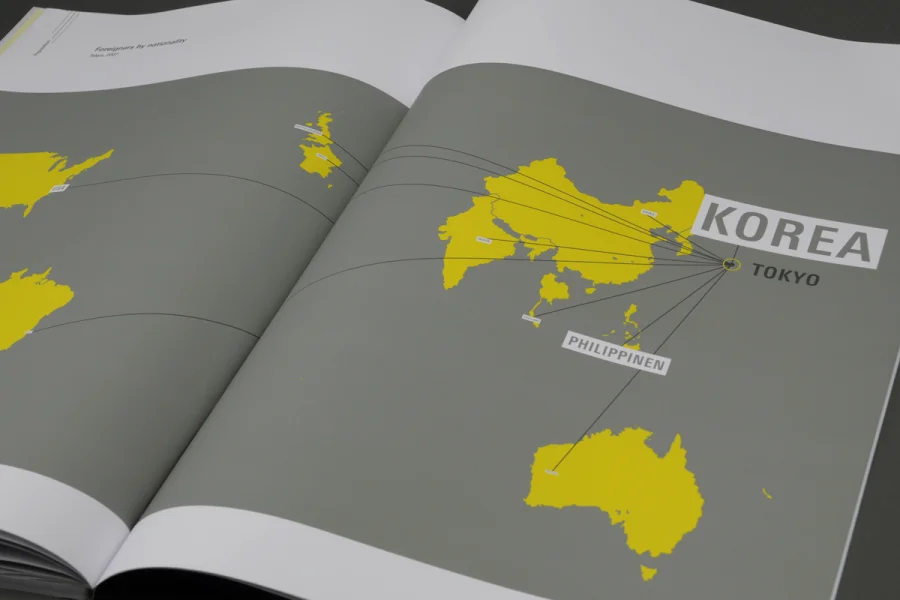
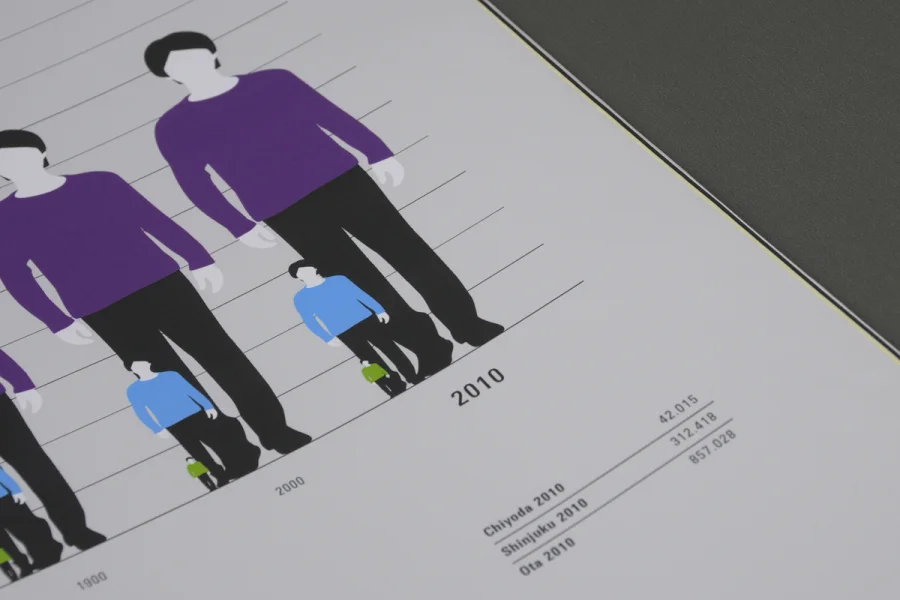
In my work ›Welcome to Tokyo‹ I dealt with visualizations of geographical, demographical and historical facts and figures about the japanese metropolis Tokyo. For an optimum comprehensibility I‘ve been experimenting with different forms of graphical representation. The focus is on the complex road network, the networked subway system, the demographic development and the commuter traffic of Tokyo. Finally I developed an information atlas, which contains cartography as well as visualized statistical data.
By Elena Frielinghaus
Informationdesign, Prof. Hartmut Brückner, University of Applied Sciences Münster, Germany